My data interests extend beyond traditional sources, leading me to dip my toes into Geographic information systems (gIS) and remote sensing.
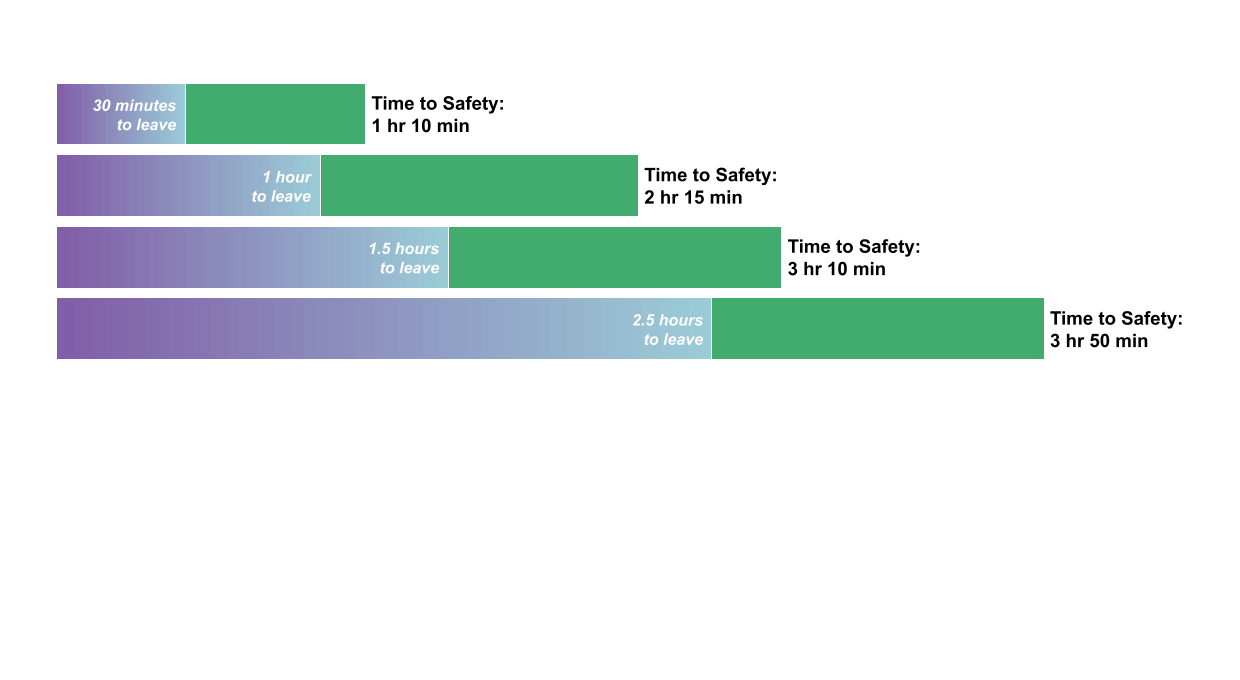
The Evacuation Time Study Project was a two-year venture, during which the City of Berkeley enlisted engineering company KLD to develop models simulating how much time various evacuation scenarios would take were there to be a major fire in the Berkeley Hills today. While the 340-page report was invaluable, we decided to make a more easily digestible, resident-friendly version. Using the ArcGIS StoryMaps platform, we crafted both visual-forward and simple text (screen-reader-friendly) narratives to ensure the key takeaways surfaced from the study were accessible to all members of the community.
CITY OF BERKELEY evacuation collection


modeling vulnerability in the Wildland urban Interface (wui) through LiDAR and maxar/planet Data
Ongoing Research
Tools: ArcGIS Pro, Google Earth Engine
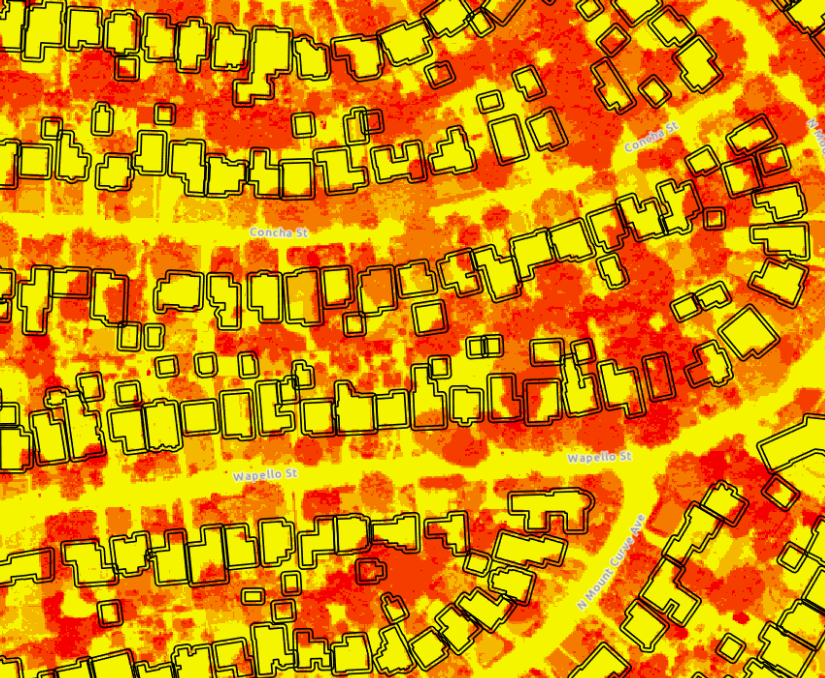
Defined 5ft defensible space buffer around structural footprint.

Assigned NDVI scores for structure and defensible space buffer.
Exploring Classification methods in ArcGIS Pro and Google Earth Engine (GEE)
UNSUPERVISED CLASSIFICATION (ISO CLUSTERING) TO ANALYZE LAND COVER CHANGE BETWEEN 2004 AND 2024
Tools: ArcGIS Pro, Excel


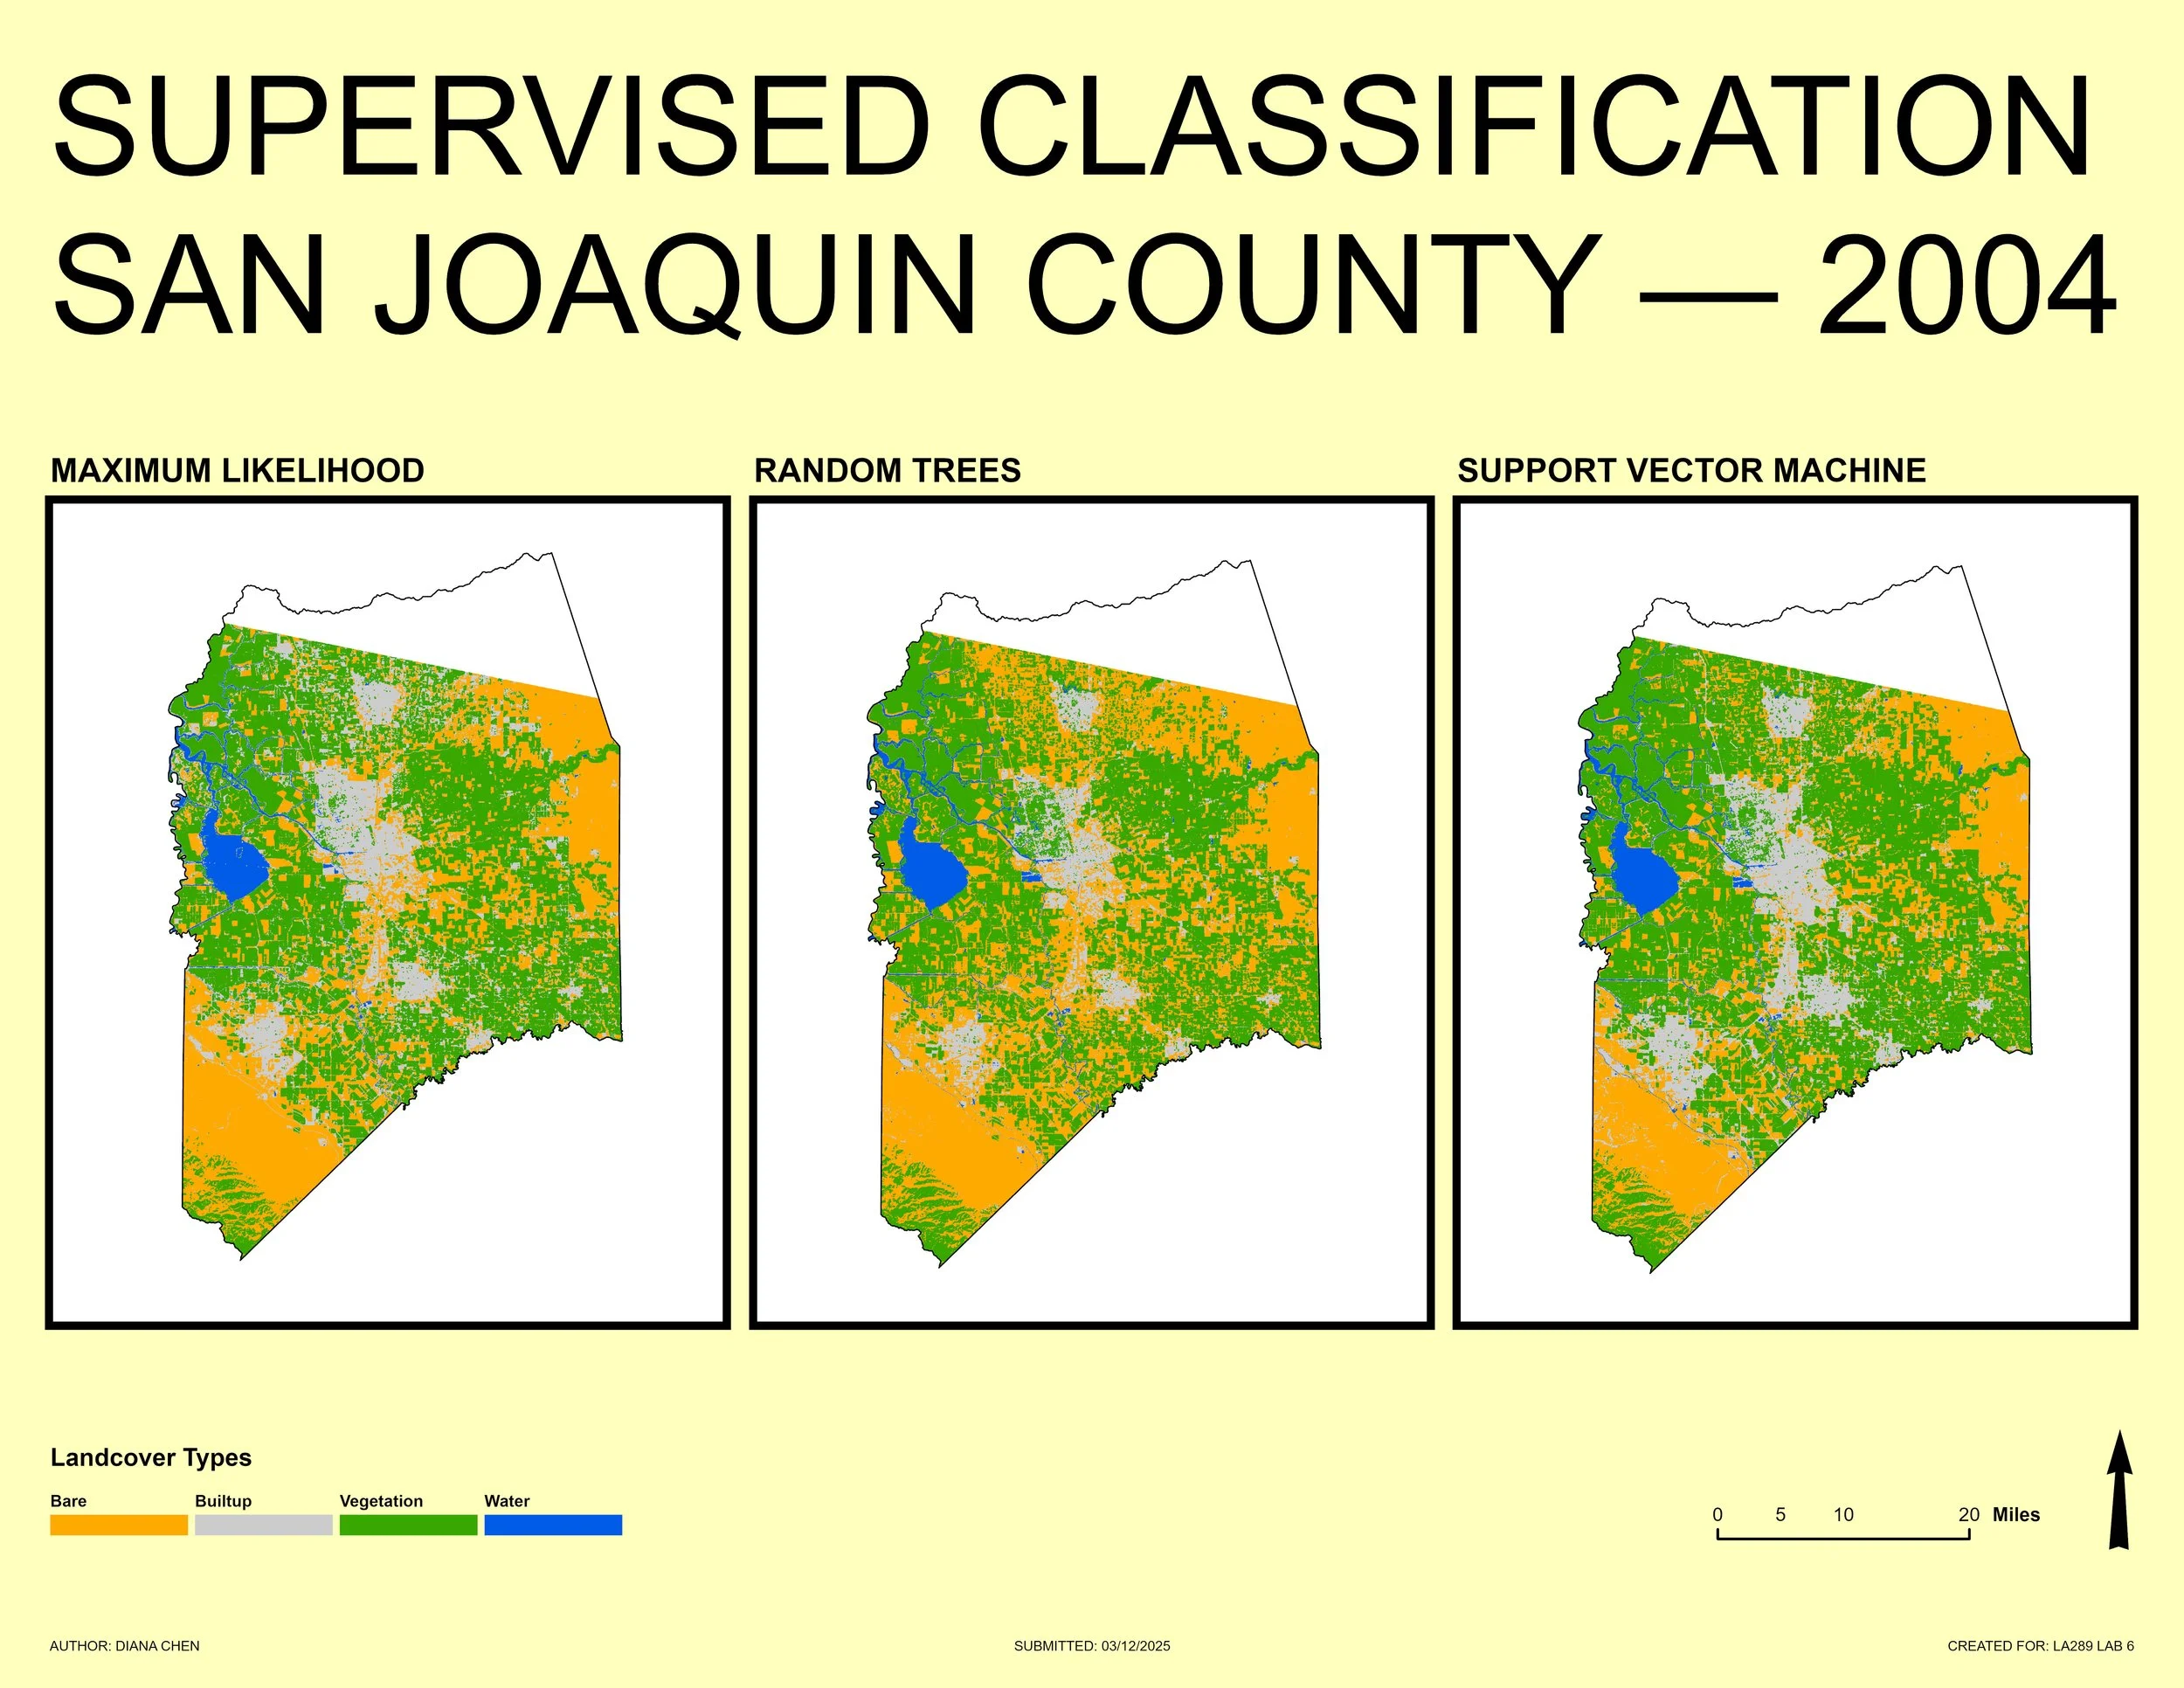
COMPARING SUPERVISED CLASSIFICATION METHODS (MAXIMUM LIKELIHOOD, RANDOM TREES, AND SUPPORT VECTOR MACHINE)
Tools: ArcGIS Pro

RANDOM TREES SUPERVISED CLASSIFICATION METHOD TO COMPARE CHANGES IN SPECTRAL SIGNATURE BETWEEN 2004 AND 2024
Tools: Google Earth Engine (GEE)


BART EXPANSION Proposal
Using the most recent census data available in 2022, I found that expanding BART’s South Bay reach with four (4) new stations would serve an estimated 324,797 residents. This would also alleviate traffic congestion and emissions from up to 120,479 single-occupancy vehicle commuters.
The prospective residents served per Unique Proposed Station (2 mile buffer) include:
Alum Rock/28th ST: 160,866
Downtown San Jose: 151,073
Diridon: 175,576
Santa Clara: 107,257
The serviced area would also include 27 roads [1] and 17 high schools [2], allowing for improved access to members of the working class and those pursuing educational advancement.
[1] 1st, 7th, 10th, 17th, Alum Rock, Autumn, Bascom, Brokaw, Connecting, De La Cruz, Lafayette, Leigh, Market, Meridian, Monroe, Monterey, Montgomery, San Antonio, San Carlos, Santa Clara, Saratoga, Senter, Stevens Creek, Story, The Alameda, WB De La Cruz to WB Lewis, Winchester
[2] ACE Charter High, Adrian Wilcox High, William C. Overfelt High, Apollo High, Del Mar High, Yerba Buena High, Foothill High, James Lick High, Learning in an Urban Community with High Achievement (L.U.C.H.A.), Lincoln Plus High, Abraham Lincoln Senior High School, Middle College High, San Jose Community High, San Jose High Academy Plus, San Jose High, Santa Clara High, Willow Glen High
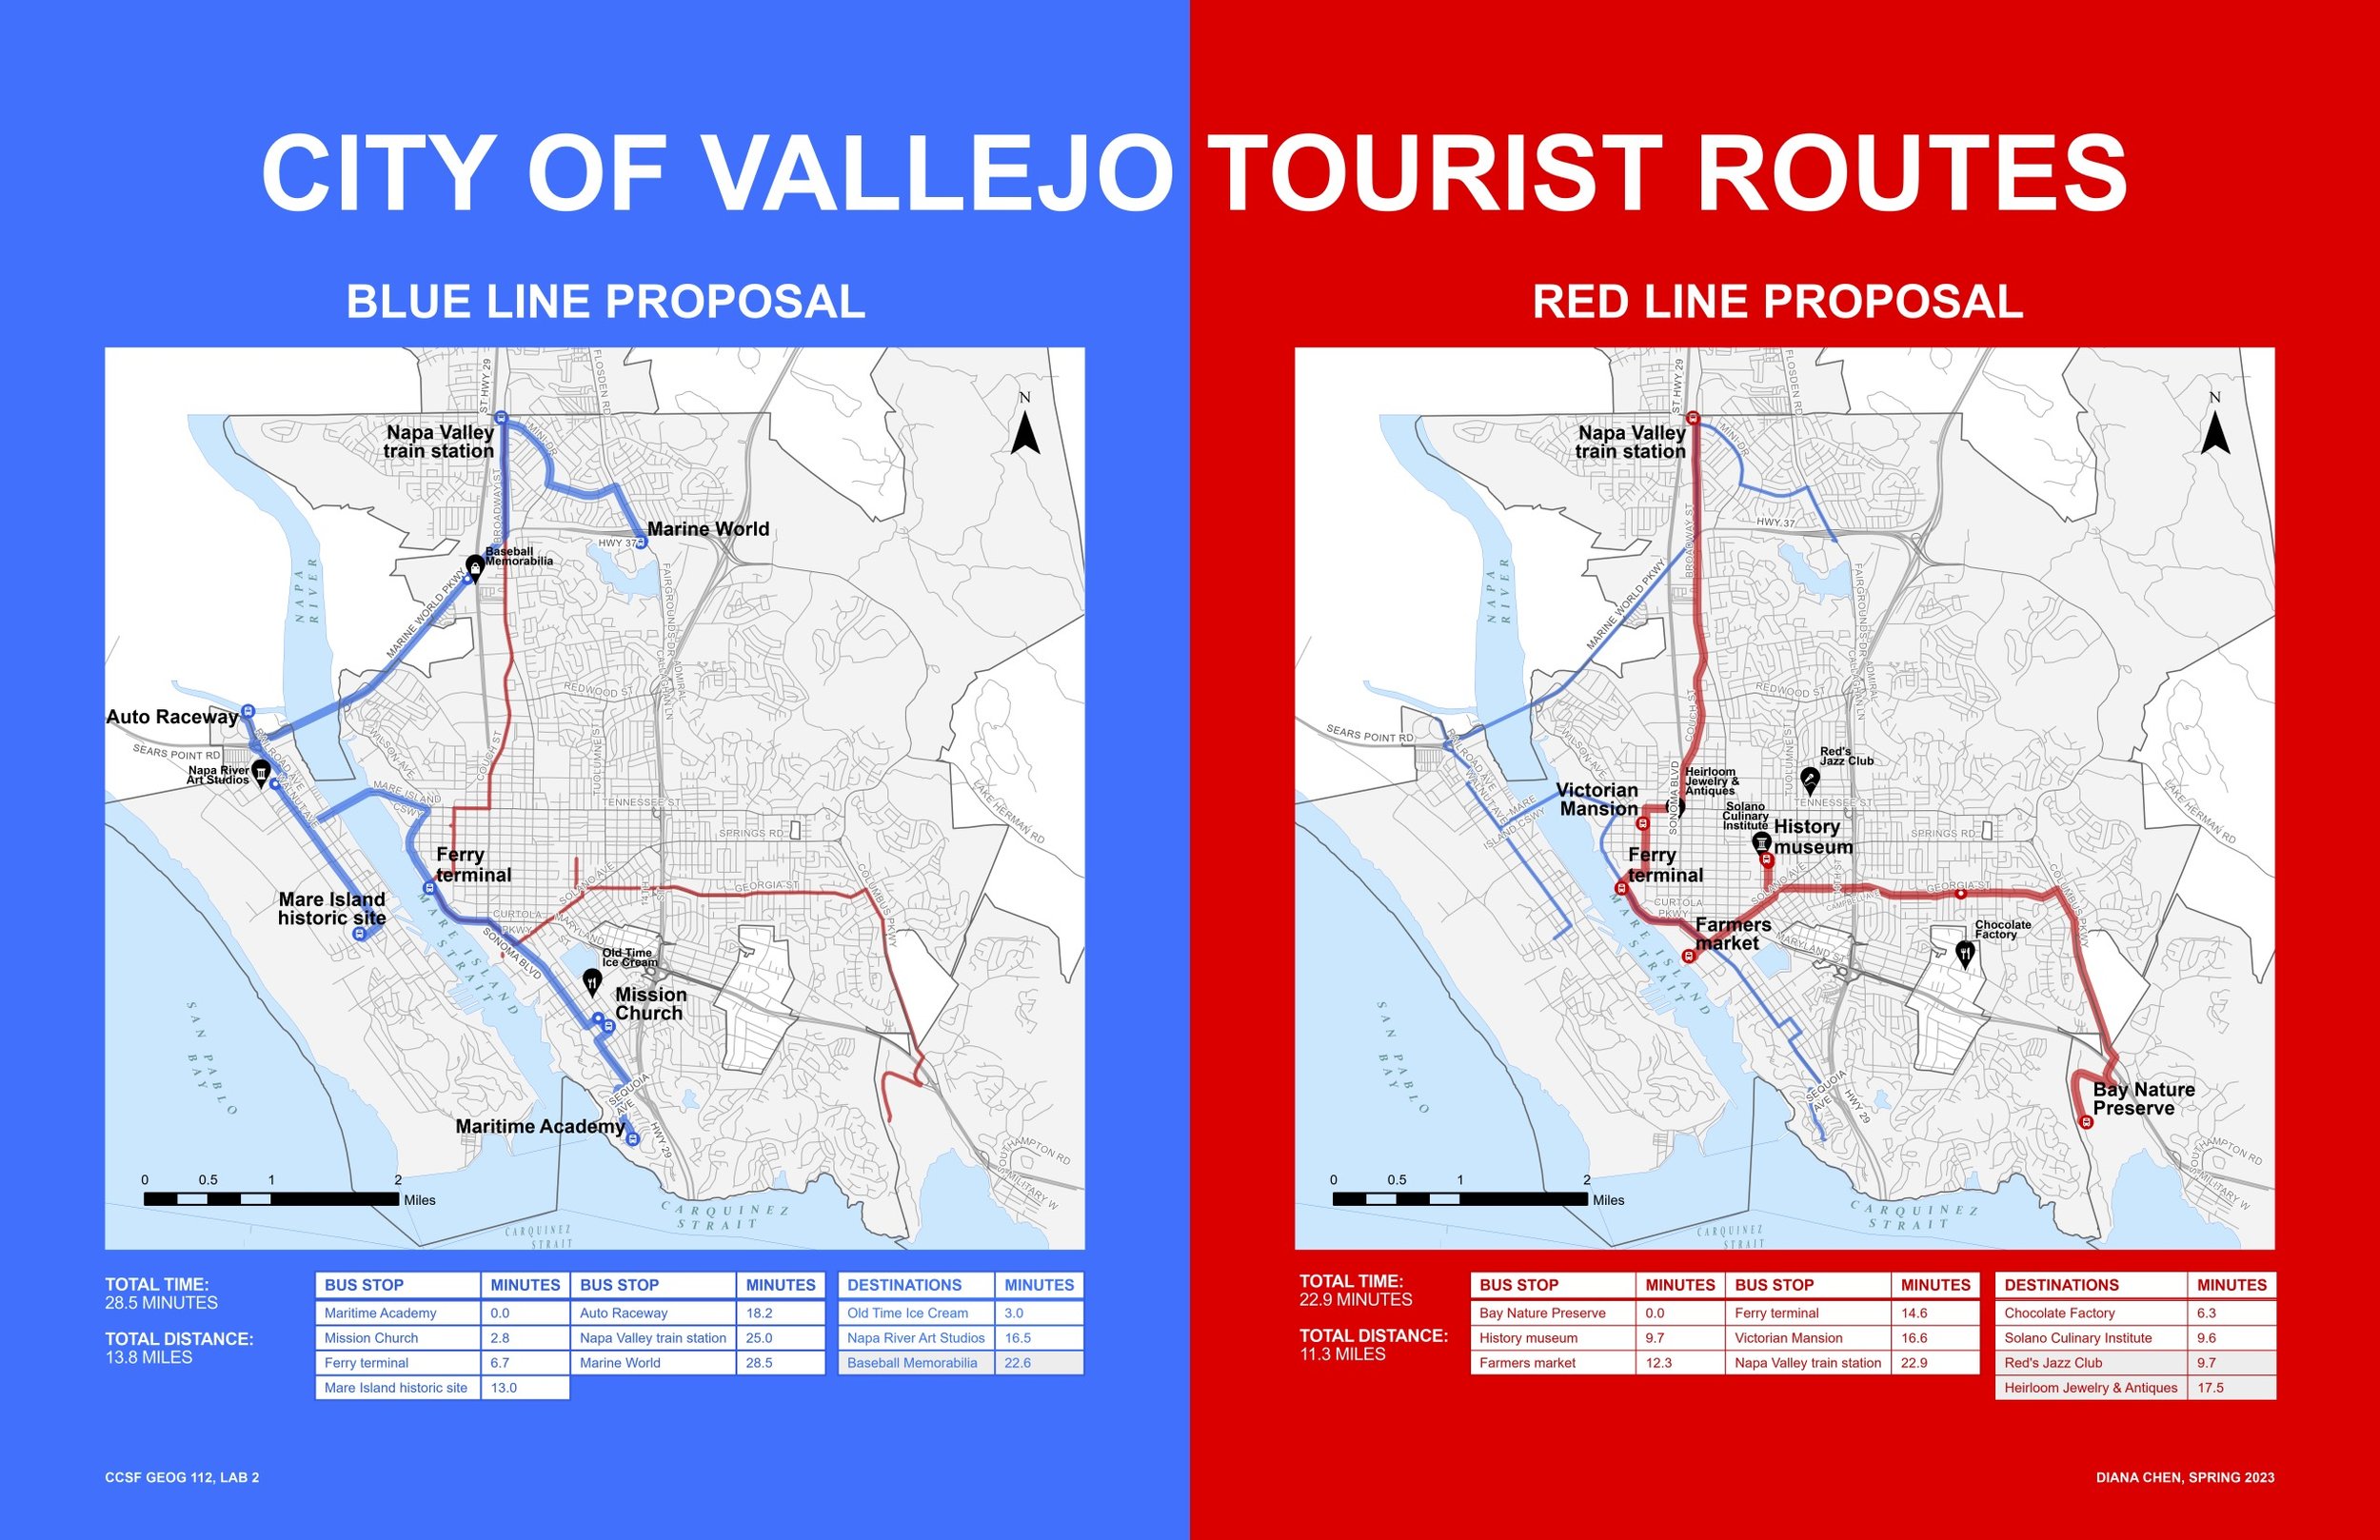
City of Vallejo Tourist Routes
Given the locations deemed “tourist attractions,” I used ArcGIS to calculate the most efficient routes based on street directions and distance.
Bike Pod Site Suitability Study
Goal: Create a more connected and healthy San Francisco.
Physical health = normalize biking as a mode of transport
Economic health = make job opportunities more accessible and affordable
Social health = connecting people of different communities (socialization)
Environmental health = provide a viable alternative to driving a single-occupancy vehicle (SOV)
Use Cases: Daily commute (primary), Errands/daily needs, Fun/leisure/touristing
Interview Insights
What is the time/ease threshold when trying to make it to/from a destination? Time/cost leaks from trying to find parking and a secure lockup.
Biking isn’t the easiest way to move through SF. Fewer SOVs could help in some parts. Partner with programs, like Commuter Shuttle Program, looking to lessen number of SOVs on streets?
Biking can be an option if it’s not too strenuous or long. Opportunity to supplement a more “door-to-door” commute (bike from home to nearby pod/commute stop)
If parking was safer, this person could be converted to a bicycle believer.
Scoring Weights
1. Bike lane accessibility (within ¼ mile to existing bike lane) → up to 3 pts
2. Population density (potential reach) → up to 3 pts
3. Slope suitability (installation feasibility) → up to 3 pts
4. Shuttle proximity (supplement to commuter shuttle program and mass transit) → up to 2 pts
5. Adoption potential (is there a relationship between bike and SOV usage → is biking already recognized as a somewhat viable option in the area → are there SOV commuters who could be converted to bicycle and transit users) → up to 1 pt
Interpreting the Scores
Tier 1 (10-12 pts): Large reach and almost turn-key scenario to install a bike pod.
Tier 2 (7-9 pts): While a bit less than ideal, these sites have potential to be fantastic areas of opportunity.
Tier 3 (6 or fewer pts): In their current states, these locations have too many physical hurdles to make them viable bike pod recipients at this time.
–––
INTERVIEW SOUND BITES
“I drive because it’s more convenient, and waiting for public transport just takes too long. Sometimes taking Bart can be efficient…to get to certain parts of the city…I’ve done the bike/Bart combo, but I got parts stolen.”
– J.T. –
“My brother and boss bike. But I don’t really want to get hit by a car. There are some streets and intersections that don’t follow a grid and cars can be unpredictable.”
– B.A. –
“These SF hill are crazy, and I don’t really want to get to work all sweaty.”
– M.P. –
“I’ve tried the bike thing. Not a huge fan. Lots of stealing even with the best locks.”
– M.L. –
–––